After this module you will be able to open an EDF in MNE, navigate it with the keyboard, read time, channel and amplitude off the display, and run a five-point first-look check on any new recording. You will also be able to spot eyes-closed alpha: a visible 10 Hz ripple over O1, O2 and Pz.
Anatomy of the display #
Every EEG viewer, from clinical software to MNE, uses the same layout:
- Time on the x-axis, usually 10 seconds per screen.
- One row per channel, conventionally front of the head at the top, back at the bottom (or grouped by chain in a bipolar montage).
- A scale bar in microvolts showing how tall a given voltage is. Without it, you cannot tell a 20 µV ripple from a 200 µV one. Always check it before judging size.
- Upward deflection is positive voltage by default in MNE. (Clinical EEG traditionally plots negative up. If someone says a blink "goes down", check which convention they use.)
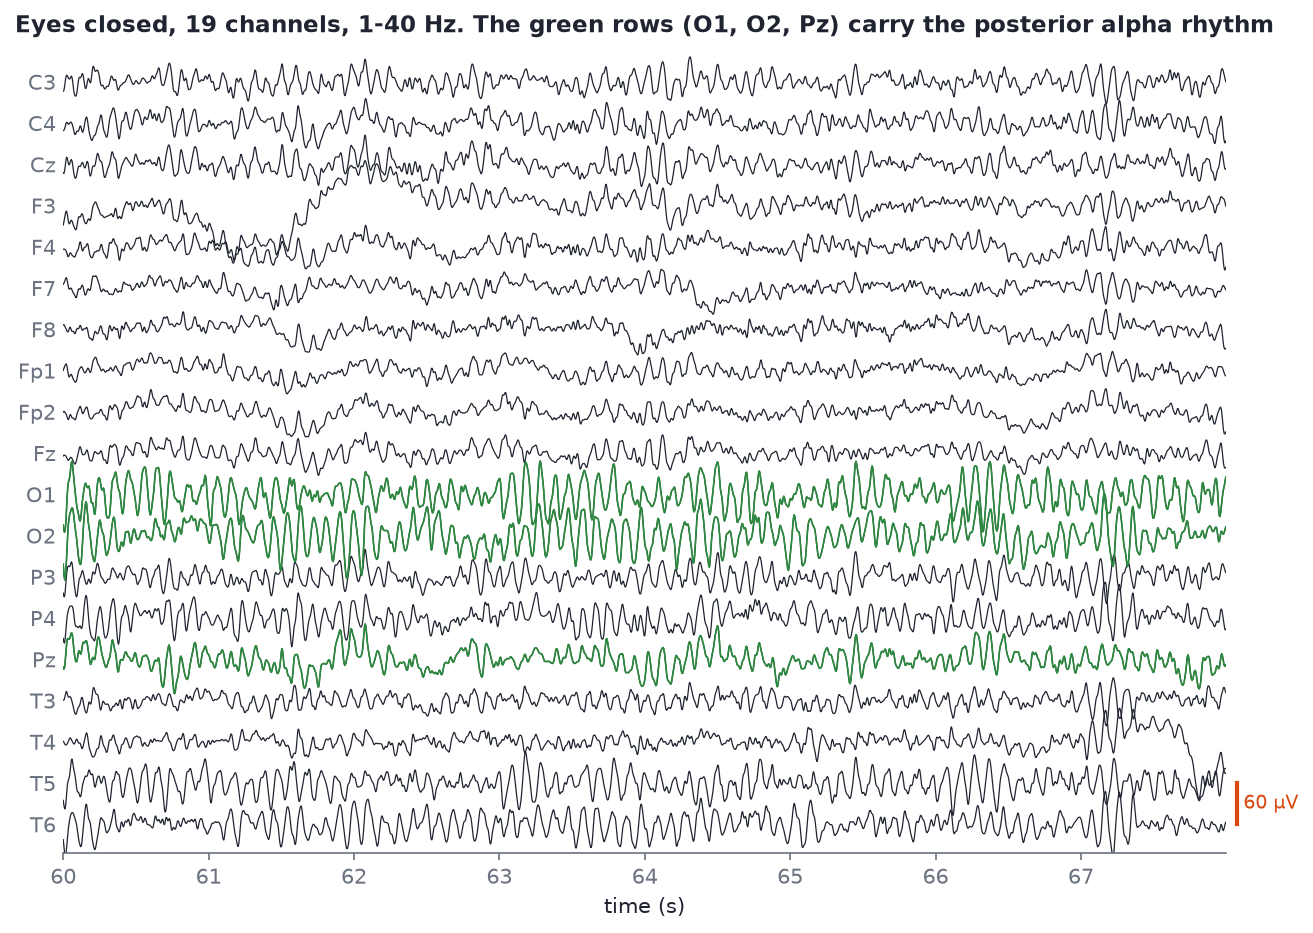
Eight seconds of s01_rest_eyes-closed_19ch.edf, filtered 1-40 Hz, 60 µV between rows. The green rows (O1, O2, Pz) carry the posterior alpha rhythm.
What to read off this figure:
- The bottom rows ripple at about 10 Hz. That regular ripple on O1, O2 and Pz (and less so P3, P4, T5, T6) is eyes-closed alpha. Count the cycles in one second if you doubt it.
- The top rows are quieter and less regular. Frontal channels carry less alpha.
- Nothing is perfectly clean. There are small slow wobbles and a few sharp bits. That is normal for real data.
Where the alpha is #
A topomap is a top-down head drawing coloured by some value at each electrode, interpolated in between. Here the value is alpha power.
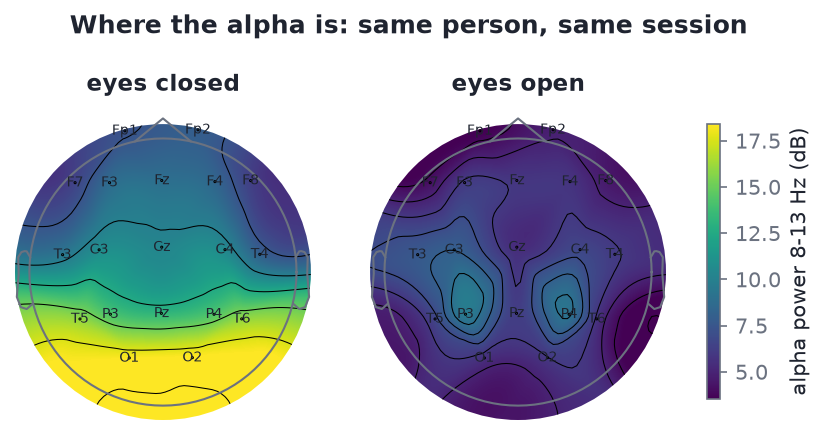
Alpha power (8-13 Hz, dB) from s01 (eyes closed) and s02 (eyes open), same colour scale. Eyes closed, alpha is concentrated over the occipital electrodes; eyes open, it drops everywhere.
If you ever compute an eyes-closed alpha topomap and the maximum is not at the back of the head, suspect the montage (electrode positions attached wrongly) or the channel names before you suspect the brain.
Navigating in MNE #
from eeg101 import load_sample

raw = load_sample("rest_ec")
raw.filter(1.0, 40.0)                          # see Module 07 for why
raw.plot(duration=10, n_channels=19, scalings=dict(eeg=50e-6))
scalings=dict(eeg=50e-6) sets how many volts fill one row's height (here 50 µV); MNE works in volts internally, so microvolts are written e-6.
Keyboard shortcuts in MNE's browser window (press ? in the window for the full list in your version):
| Key | Does |
|---|---|
| ← / → | Scroll back / forward in time |
| ↑ / ↓ | Scroll through channels |
+ / - |
Increase / decrease amplitude scaling |
| Page Up / Page Down | Show more / fewer channels |
| Home / End | Shorter / longer time window |
a |
Annotation mode: drag to mark a segment (for example "BAD_blink") |
| Click a channel name | Mark it bad (it turns grey) |
? |
Help |
The first-look checklist #
Do this with every new file, before computing anything. It takes two minutes and saves hours.
- What is in it?
print(raw.info)andprint(raw.ch_names). How many channels, which names, which sampling rate, how long? - Is the sampling rate what you think? Read
raw.info["sfreq"], never assume. In the course samples,s02is 249 Hz ands09/s10are 251 Hz, not 250. Code that hard-codes 250 will be subtly wrong. - Is there a DC offset? Raw dry-electrode data sits far from zero: channel medians in
s01range from about -198,000 to +43,000 µV. That is the electrode-skin interface, not brain. MNE's viewer hides it by default (remove_dc=True), but statistics on the unfiltered data will not. A high-pass filter (Module 07) removes it. - What do the start and end look like? People take headsets off before stopping the recording. In
s05ands06the last 4-5 seconds swing over 300,000 µV peak to peak, against a few hundred to a couple of thousand microvolts per 5 s window earlier in the same recordings. Scroll to the end (press End, then →) before you analyse anything, and crop the junk:raw.crop(tmax=raw.times[-1] - 5). - Any flat or crazy channels? Scroll through once at a sensible scale. A flat line or a channel ten times bigger than its neighbours is an electrode problem; mark it bad.
import numpy as np

raw = load_sample("artifacts_ec")             # s05, unfiltered
sf = raw.info["sfreq"]
print(raw.info["sfreq"], len(raw.ch_names), raw.times[-1])
last5 = raw.get_data()[:, -int(5 * sf):] * 1e6
print("peak-to-peak in the last 5 s (µV):", np.ptp(last5, axis=1).max().round())
Spotting eyes-closed alpha by eye #
Eyes-closed alpha in a healthy adult is the first pattern to learn because it is so reliable:
- Frequency: roughly 8-12 Hz; count about 10 cycles per second.
- Location: largest at O1, O2 (and Oz if present), then Pz, P3, P4, T5, T6.
- Shape: rounded, sinusoidal waves that wax and wane in spindles of a second or two.
- Reactivity: it shrinks or disappears within a fraction of a second when the eyes open. If you have an eyes-open recording from the same session (
s02), scroll both at the same scale and compare the bottom rows.
Not everyone has strong alpha. A minority of healthy adults have low-amplitude alpha that is hard to see by eye; it still shows up in a spectrum (Lab 1).
Exercise #
- Open
s01with the code above. Find a 10-second stretch where alpha is obvious and screenshot it. - Open
s02(eyes open) at the same scaling. Screenshot the same channels. - Run the first-look checklist on
s05(load_sample("artifacts_ec")). Write down the sampling rate, duration, and where the junk at the end starts.
Self-check #
Name the three things you must read off any EEG display before interpreting it.
The time axis (how many seconds per screen), which channel each row is, and the amplitude scale (µV per row or the scale bar).
Your eyes-closed alpha topomap peaks at the forehead. What do you check first?
The montage and channel names: positions attached wrongly, or names not matched to positions. Eyes-closed alpha should be posterior.
Why read `raw.info["sfreq"]` instead of assuming 250 Hz?
Devices do not always record at round rates; two course samples are 249 and 251 Hz. Anything computed in samples (window lengths, filter design, time stamps) is wrong if the rate is wrong.
Raw values in a file are around -150,000 µV. Is the person's brain doing something extreme?
No. That is a DC offset from the electrode-skin contact. Brain signals are tens of microvolts riding on top. A high-pass filter removes the offset.
Notes file prompts #
- Screenshots from the exercise, labelled.
- Your own copy of the first-look checklist.
- Question for Alex: what does the Divergence viewer do by default about DC offset and filtering?